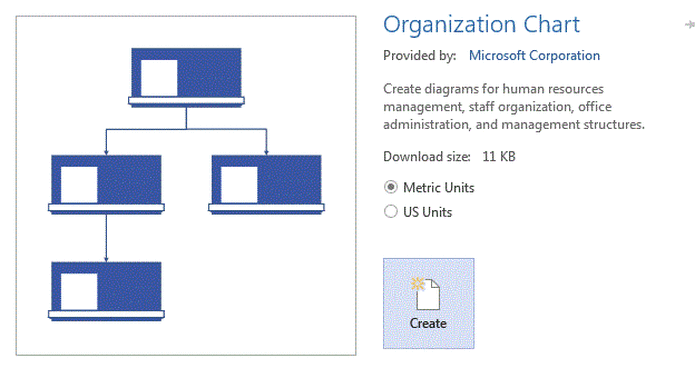
 Visio interface to create an Organisation Chart
 Here is the list of useful diagrams for business analysts working in information technology, information technology enabled services (ITES), BPO and KPO sectors. Diagrams categorised under business category are utilised by business consultants as well
1) Organisation Chart : Organisation chart or organisation modelling diagram can be prepared by business analysts in MS Visio or other softwares like Magic draw or even in power point or ms word . It can be utilized for Stake holder mapping also
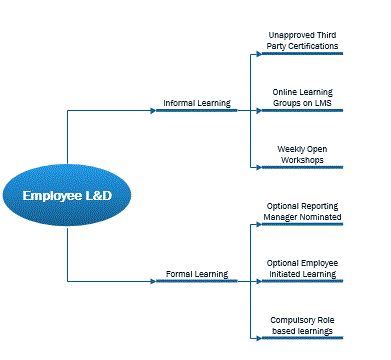
2) Brainstorming : Brainstorming diagramming template is available in MS Visio. The same template can be used for Issue tree analysis or Hypothesis testing
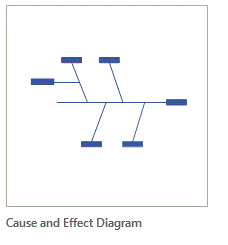
| 3) Cause and Effect Diagram : Cause and Effect diagram is also called as Ishikawa diagram or a fishbone diagram you can make a beautiful fishbone diagram through visio. It allows you to do deep analysis of root cause a given situation. A given business situation may happen due to more than many reasons. We categorize these reasons and then identify causes under these categories |


 RSS Feed